Trucking Lab
Arizona Truck Parking Study Data

Arizona truck parking data for stronger DOT proposals

Get verified inventory, shortage screening, corridor context, and proposal-ready outputs without rebuilding the analysis from scratch.

Why it matters: Better parking evidence makes unmet demand and investment priorities easier to defend.

DOT proposal support Parking inventory Shortage screening Corridor analysis

Arizona parking, at a glance

159
Private parking locations
7,423
Private parking spaces
29
Public parking locations
713
Public parking spaces
203 grids already short

Arizona planning material names Phoenix, Flagstaff, I-10, and I-40 as the high-demand areas. Freight growth and the Electronic Logging Device mandate keep pushing drivers into undesignated parking.

Larger facilities, heavier shortage

  • More than 44% of locations have 15 or fewer truck spaces.
  • About 20% have five or fewer spaces.
  • Paid facilities average approximately $13.80 per night.

Grid screening across approximately 2,359 hexagons:
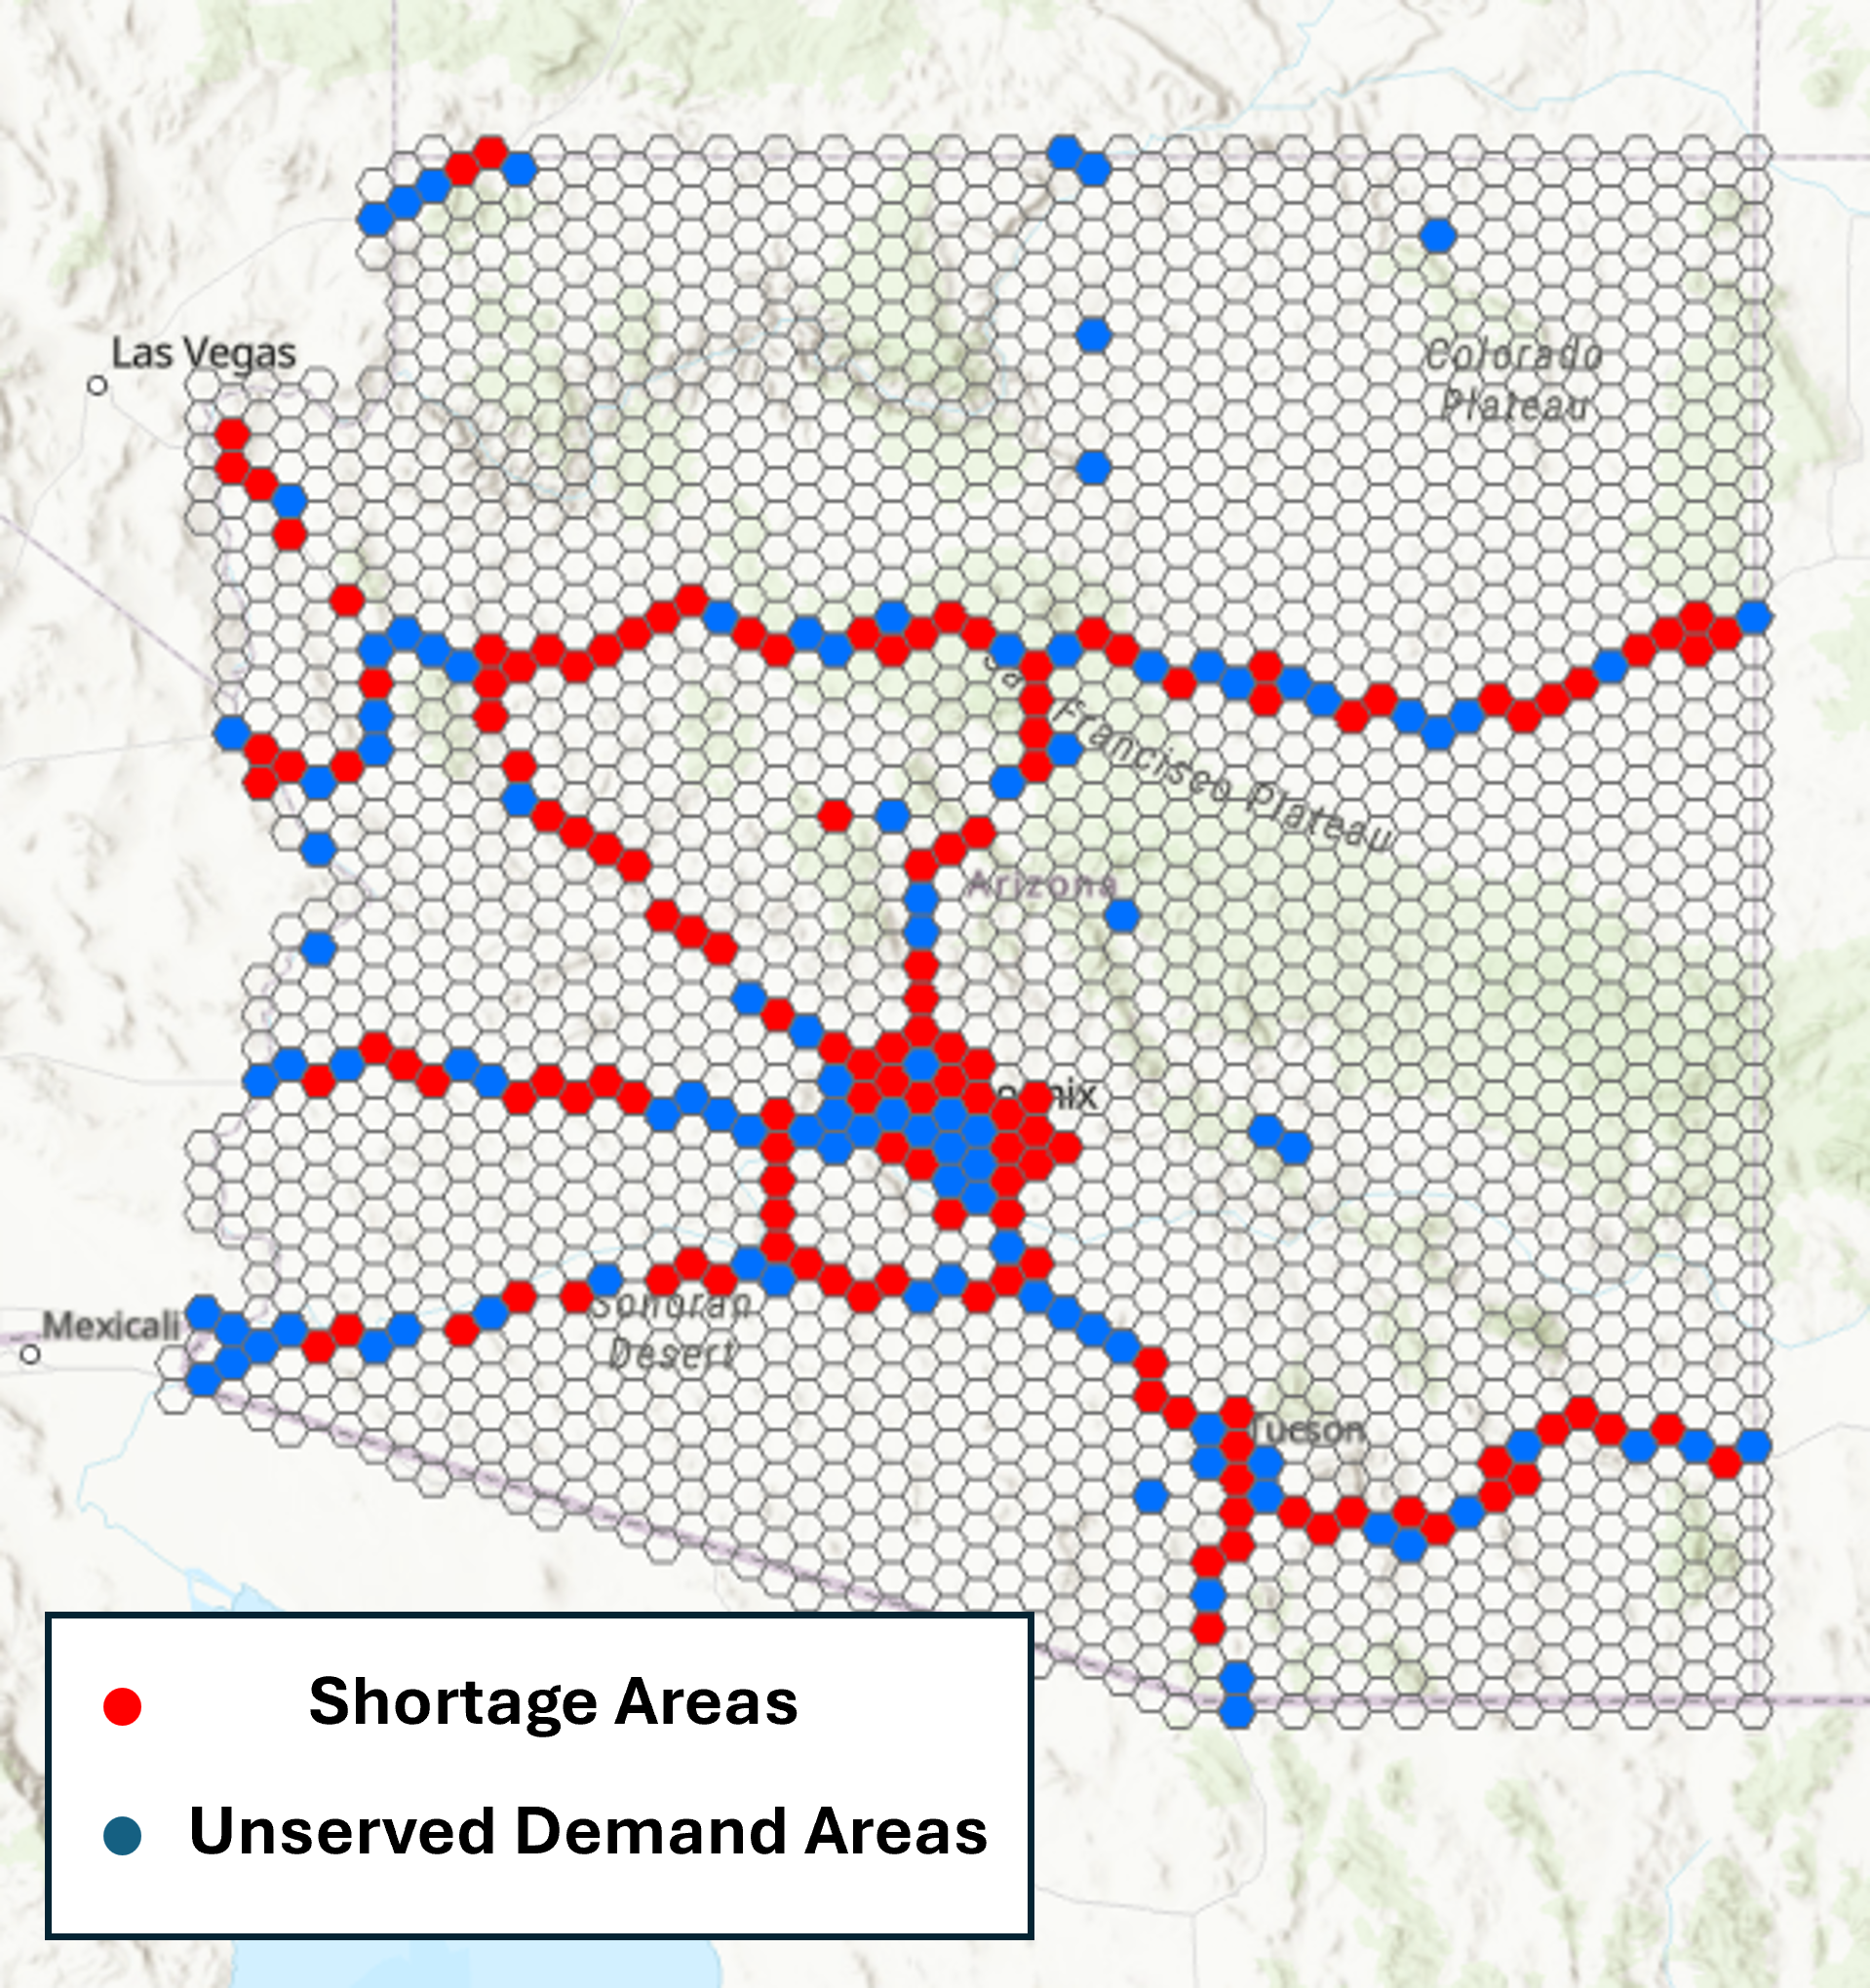
  • 203 shortage grids: peak utilization exceeds 90%.
  • 104 demand grids: modeled demand exists without an official parking location.
Arizona truck parking shortage and demand screening map

Why this matters in a competitive DOT proposal

Typical approach

  • Unscreened facility lists
  • No distinction between usable and incidental parking
  • Weak connection to the proposal narrative
  • Limited support for investment prioritization

With Trucking Lab

  • Planning-ready Arizona inventory
  • Shortage and utilization context
  • Clear corridor and project logic
  • Outputs ready for technical documents

Counts describe supply. Context explains the need.

Arizona pressure clusters, it does not spread evenly. Your proposal should show where undesignated parking is happening, what it costs in safety and infrastructure damage, and which corridor gets funded first.

What you get

Base Arizona data

  • Parking inventory by location
  • Public and private classification
  • Truck-space counts and amenities
  • Planning-use screening

Proposal-ready outputs

  • GIS-ready dataset
  • Hotspot and corridor context
  • Draft-ready charts and figures
  • Executive summary language

Deeper analysis

  • Truck parking demand model
  • Parking patterns analysis
  • Safety and equity framing
  • EV truck-charging suitability

Built for consulting teams

  • Freight plan teams
  • DOT truck parking study teams
  • MPO and corridor study teams
  • Grant and infrastructure advisers

Reality check

Counts differ across sources because inclusion rules differ. Public totals and Trucking Lab numbers are complementary — one gives statewide context, the other gives usable supply.

Common questions

How many truck parking spaces are in Arizona?

Trucking Lab includes 7,423 private truck parking spaces across 159 locations and 713 public spaces across 29 locations.

Where is pressure concentrated?

Arizona planning material points to Phoenix, Flagstaff, and the I-10 and I-40 corridors as the leading high-demand truck parking areas.

Why is demand growing in Arizona?

State freight planning material ties rising demand to freight volume growth and the Electronic Logging Device mandate, which increased the pressure to find legal, usable parking.

Why do truck parking counts differ across sources?

Counts differ because datasets apply different facility definitions and inclusion rules. Public totals provide statewide context, while Trucking Lab numbers focus on usable parking supply.

Need Arizona truck parking data now?

Tell us about the proposal or study. We will help you move from parking inventory to a defensible investment story.