How to Build a More Accurate Truck Parking Inventory?
The U.S. faces a persistent shortage of truck parking, particularly during peak overnight hours (7 PM to 4 AM) when most drivers take federally mandated 10-hour rest breaks. Accurately measuring parking lot capacity during these hours—defined here as the maximum number of trucks a facility can accommodate—is critical to addressing this crisis. However, the lack of standardized measurement methods complicates efforts to quantify the problem. Our research team analyzed data from Jason’s Truck Parking Surveys (2015 and 2019) and found inconsistencies in how states measure capacity, undermining national solutions. Below, we propose a flexible framework for estimating capacity across diverse parking environments.
A Question for You
Take a look at the photo below. How many trucks do you think this public rest area can hold?
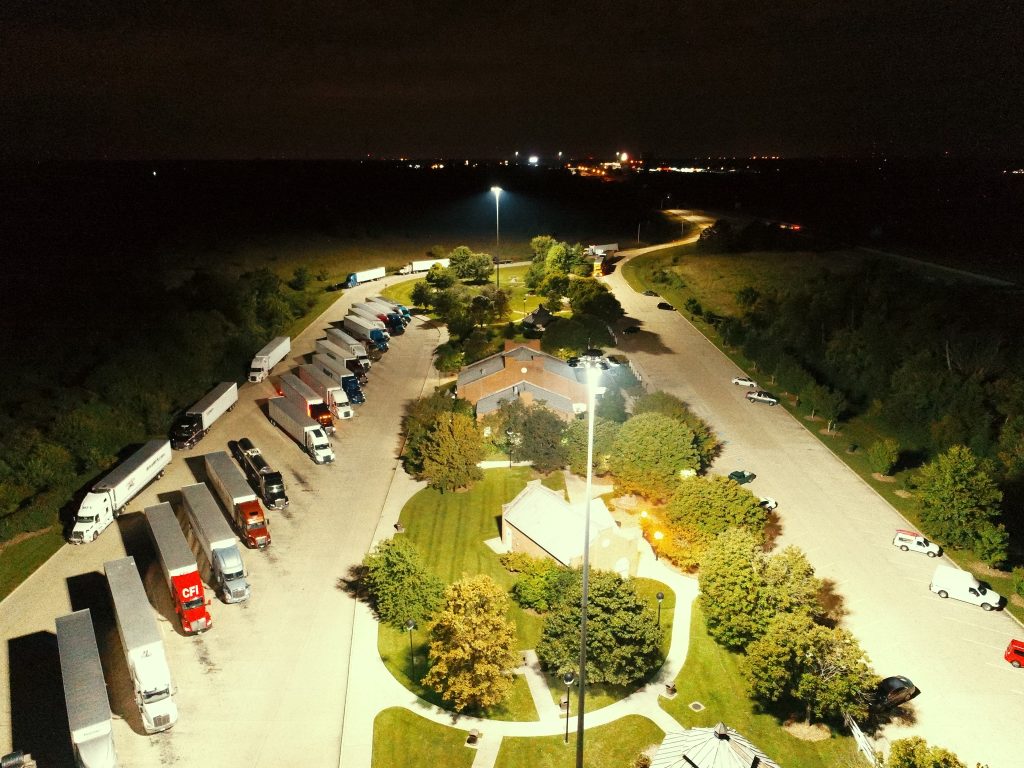
Kentucky Transportation Cabinet
At first glance, you might count about 20 trucks. But here’s the twist—this rest area actually fits nearly 30 trucks thanks to “creative parking”. Drivers make full use of every corner, curb, and open stretch of pavement. It’s a perfect reminder that real-world capacity often exceeds what’s officially marked on paper. In our approach, we account for this kind of practical, real-world capacity.
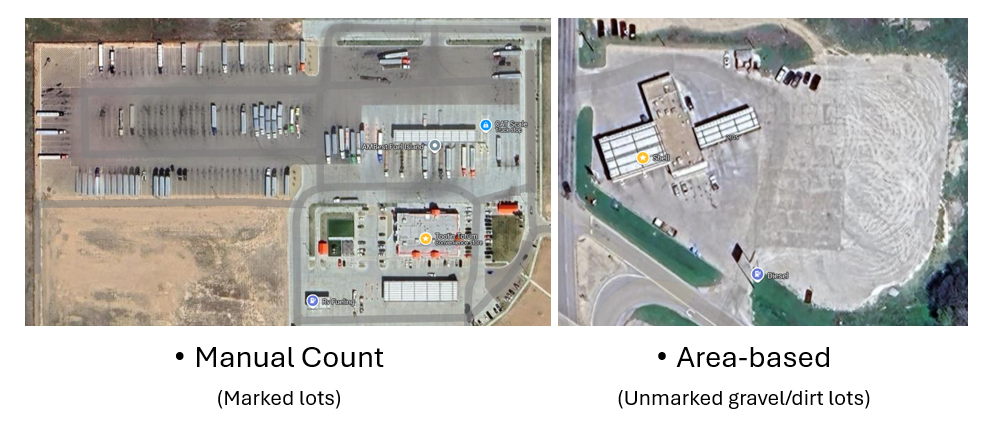
1. Public Facilities: Marked & Managed Spaces
Publicly managed rest areas, weigh stations, and service plazas often feature well-maintained pavement and clear markings, making capacity estimation straightforward.
- Tools: Google Earth, satellite imagery, or street views allow manual counting of marked spaces.
- State Resources: Many states publish parking inventories via Department of Transportation (DOT) websites, freight plans, or truck parking studies.
Limitation: These facilities rarely account for “creative parking”—using unmarked spaces like shoulders or unused land.
2. Private Truck Stops: A Mixed Bag
Large chains (e.g., Pilot, Love’s, TA) often list parking capacities online, but two issues arise:
- Terminology Gaps: Facilities may mix counts for bobtails (tractors without trailers) and standard 65+ ft semi-trucks, skewing data.
- Outdated Imagery: Satellite/street views lag behind new constructions (e.g., Love’s frequently expands).
Solution: Cross-reference company data with direct outreach to facility owners.
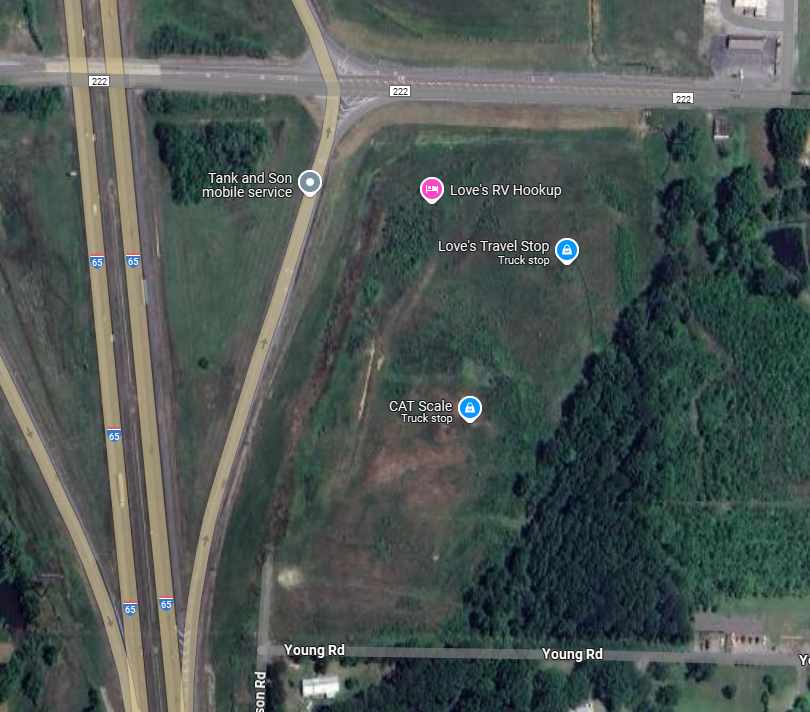
Outdated Sattlite Imagery for Newly Built Truck Stop
Smaller/Undesignated Facilities:
Restaurants, malls, casinos, and informal lots (e.g., gravel or dirt areas) present greater challenges for counting, as many lack clear markings, as shown below.
3. Unmarked Lots: Area-Based Estimation
For lots without markings, calculate total area and adjust for practical use:
Step 1: Measure Total Area
- Use Google Earth’s measurement tool or GIS software.
Example: A 10,764 sq ft lot.
Step 2: Estimate Space per Truck
- A standard semi-truck requires ~400–500 sq ft (8.5 ft width x 65–70 ft length + buffer space).
- Factor in observed parking patterns:
- Lateral Spacing: Drivers often leave 13–14 ft between trucks.
- Linear Arrangements: Single-file parking may need 80–90 ft per truck.
Example: 10,764 sq ft ÷ 450 sq ft/truck ≈ 24 trucks (range: 20–30).
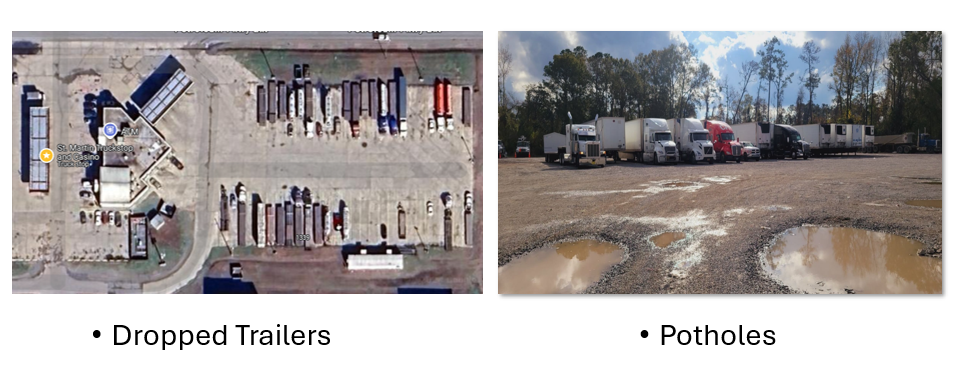
Step 3: Apply Reduction Factors
Adjust for real-world constraints:
- Obstacles: Potholes, uneven terrain, or trailer drops reduce usable space.
- Behavioral Patterns: Drivers avoid poorly lit areas or obstacles at night.
Data Sources:
- Analyze Google Maps reviews for driver-reported issues.
- Interview with facility owners.
4. The Gold Standard: Crowdsourced Data
While the above methods provide estimates, the most accurate data comes directly from truck drivers. Platforms like My Rig Parking and driver forums offer real-time updates based on user reports.
Conclusion: No One-Size-Fits-All, but a Path Forward
A universal formula for truck parking capacity remains elusive due to varying state practices and site-specific challenges. However, combining satellite imagery, area-based calculations, and crowdsourced data can bridge gaps in accurate truck parking inventory. Planners are encouraged to prioritize standardized reporting frameworks and invest in dynamic tools (e.g., sensor-based detection).
Methodology Note: All calculations assume dry, stable ground conditions. Gravel/dirt lots may require further reductions in poor weather.
More details
- Click here to learn more about this approach.
- For sample data requests or inquiries, contact our team at: 📧 team@myrigparking.com
Latest Articles/Posts
Authored, reviewed, and approved by Troy Choi, Ph.D., P.E. – Transportation Systems Optimization & Engineering Research. Google Scholar (as of 2025): Citations 168 | h-index 4 | i10-index 4