Truck Parking Data You Can Defend
Verified inventory, 24/7 utilization, and demand analysis — ready on Day 1.
Built for freight plans, DOT studies, and grant narratives.
What You Get
Three layers: what exists, what’s missing, what drivers say.
Verified Inventory
Verified supply + 24/7 utilization. Less uncertainty in freight plans, studies, and corridor reviews.
Capacity Beyond the Hotspots
You know where parking is saturated. Our demand model finds candidate zones that can absorb it — verified demand, no facility on anyone’s map.
Driver Signals, No Surveys
Thousands of public driver discussions, mined for needs, concerns, and priorities — without waiting months for survey returns.
What the Data Actually Looks Like
Real samples: facility data, utilization over time, and regional shortage analysis.
Data Integrity Sample
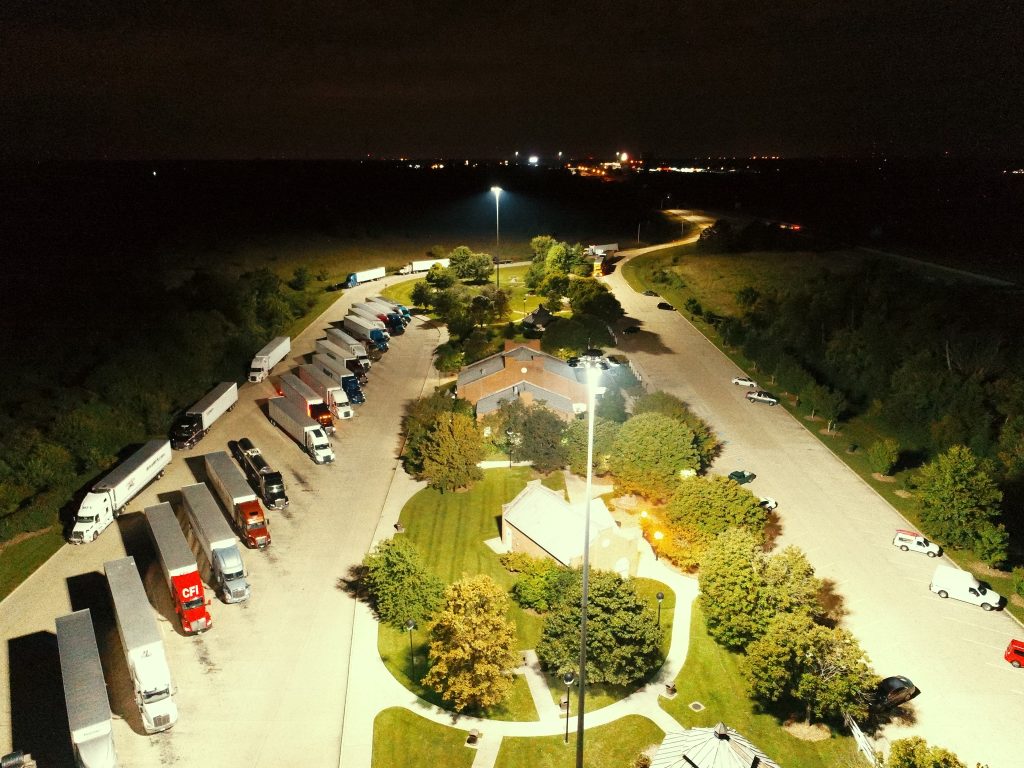
One location. Verified capacity, amenities, and utilization pattern.
McDonald’s Facility
West Branch, IA 52358
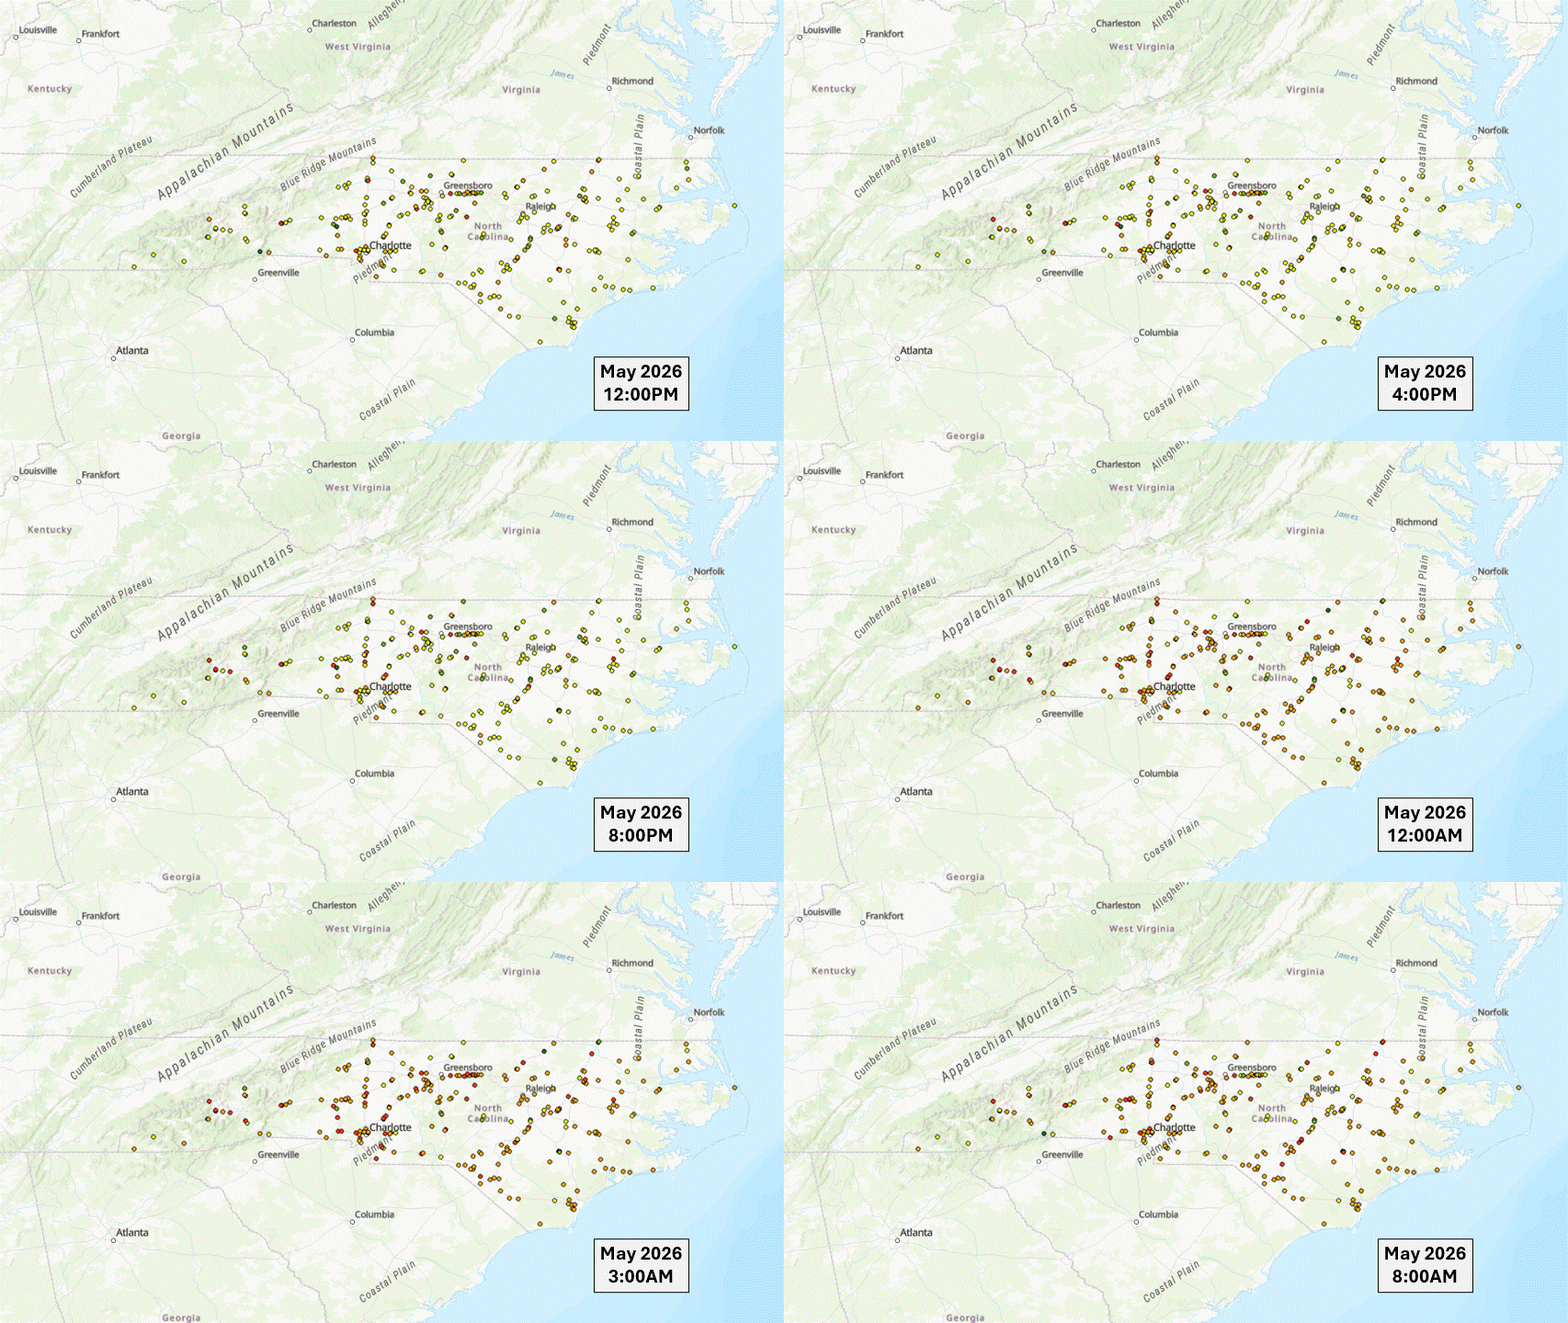
Temporal Utilization Analysis
How parking activity shifts by hour and by season.
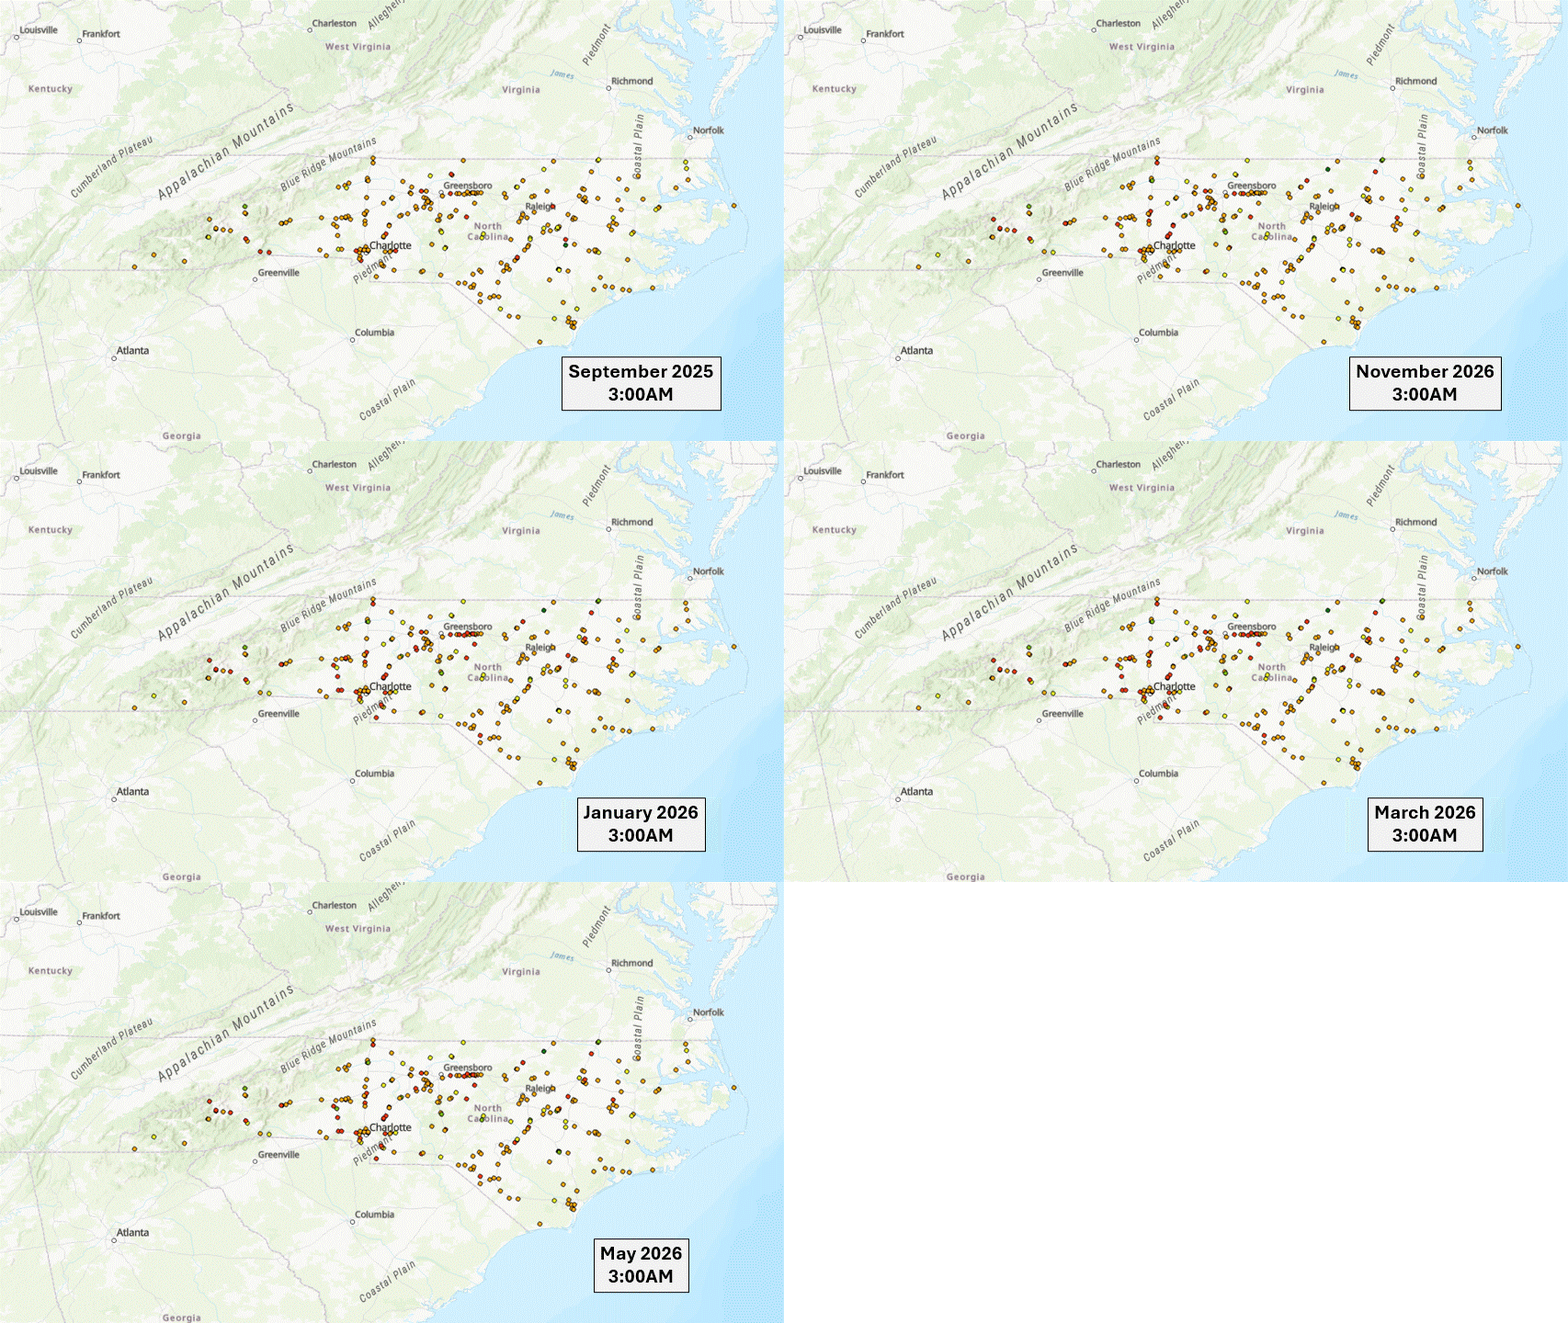
Regional Parking Deficit Analysis
Lot-level utilization shows where parking is consistently constrained.
Why Teams Choose Us?
Built for public-sector review and consulting delivery — not presentation slides.
1. Presented at TRB
Our methodology has been presented at TRB, one of the best-known U.S. transportation research forums. A stronger basis for defending the work in technical review.
2. Tailored to Your Study
Project-specific methods for demand analysis and driver need detection — including text mining that reveals what drivers want and where problems are emerging.
3. Start on Day One
11,800+ verified locations, ready now. Skip months of dataset building — your team goes straight to analysis.
Pick Your State. See the Numbers.
State-level reports for market scans, corridor reviews, and planning conversations.
Browse all state report links
Frequently Asked Questions
From DOTs, MPOs, and consulting teams.
A data partner for truck parking studies, freight plans, and DOT projects. Not just raw data — evidence and analysis you can drop straight into a report.
Verified inventories, 24/7 availability data, demand analysis, parking patterns, and qualitative insight. Together they show current conditions, where the problems are, and why investment is justified.
Multi-layer QA/QC: satellite cross-checks, phone verification, and comparison against external reference data.
Every dataset ships with a data dictionary and methodology documentation — so your team answers technical reviews with sources, not guesses.
Yes — and it takes months. We hand you a verified statewide inventory on Day 1, so your team starts on analysis and strategy, not data entry.
Those show movement. We show parking — at the facility level.
The difference: “trucks are here” vs. “this site runs 70% occupied and needs expansion” or “this county is an overnight hub for OTR drivers.”
Yes. Our Truck Parking Demand Model flags corridors where demand outruns supply — exactly where ramp and shoulder parking appears.
The output: safety risk areas, priority investment zones, and unmet-demand locations you can defend.
We check monthly model outputs against driver-reported ground truth — and publish the results. See the monthly validation report.
Yes. Data only, specific analyses, or full support alongside your team on proposals, studies, and final reports.
Tell us what you’re reviewing.
A state, a corridor, a study — we’ll reply with next steps.