Truck Parking Demand Forecast: State to Regional Scale
Key Takeaways
- Problem: We don’t have a consistent, nationwide way to see where truck parking is short today—or where it’ll be short tomorrow.
- Solution: A simple, scalable approach that uses basic traffic data and lot information to diagnose today’s need, forecast tomorrow’s need, and measure the gap—without installing sensors.
- Practitioner Commentary: Built to work at national, regional, and state levels using data agencies already have (FHWA traffic + parking lot details).
Acronyms (defined once):
HOS = Hours of Service (federal rules for how long truckers can drive before resting)
HPMS = Highway Performance Monitoring System (FHWA’s national traffic dataset)
AADTC = Average Annual Daily Truck Combinations (the combination-truck count from HPMS—our main traffic signal)
HOS = Hours of Service (federal rules for how long truckers can drive before resting)
HPMS = Highway Performance Monitoring System (FHWA’s national traffic dataset)
AADTC = Average Annual Daily Truck Combinations (the combination-truck count from HPMS—our main traffic signal)
How We Built a Scalable, Sensor-Free Truck Parking Forecasting Model
Problem Defined
Truck drivers often can’t find safe, legal places to park, making HOS compliance stressful and risky. Planners want to invest wisely, but most tools show only today’s supply, not where demand will outgrow capacity.
Objectives
- Can we forecast parking need using readily available data (HPMS + basic lot info), not expensive sensors?
- Can the method stay consistent and comparable from the national map down to a specific state?
Data Collection, Processing, and Modeling
- Data Fusion: Parking lot details (capacity, amenities, fees, typical peak crowding) + HPMS traffic—specifically AADTC as the core demand signal.
- Simple Map Frame: The country is split into same-size hexagons so every place is measured apples-to-apples.
- Two Lightweight Models:
- Diagnostic (today): Uses traffic plus context (e.g., food availability, fees) to explain current crowding.
- Predictive (tomorrow): Uses traffic only (AADTC) to cleanly project future need as traffic grows.
- Three Steps in Practice:
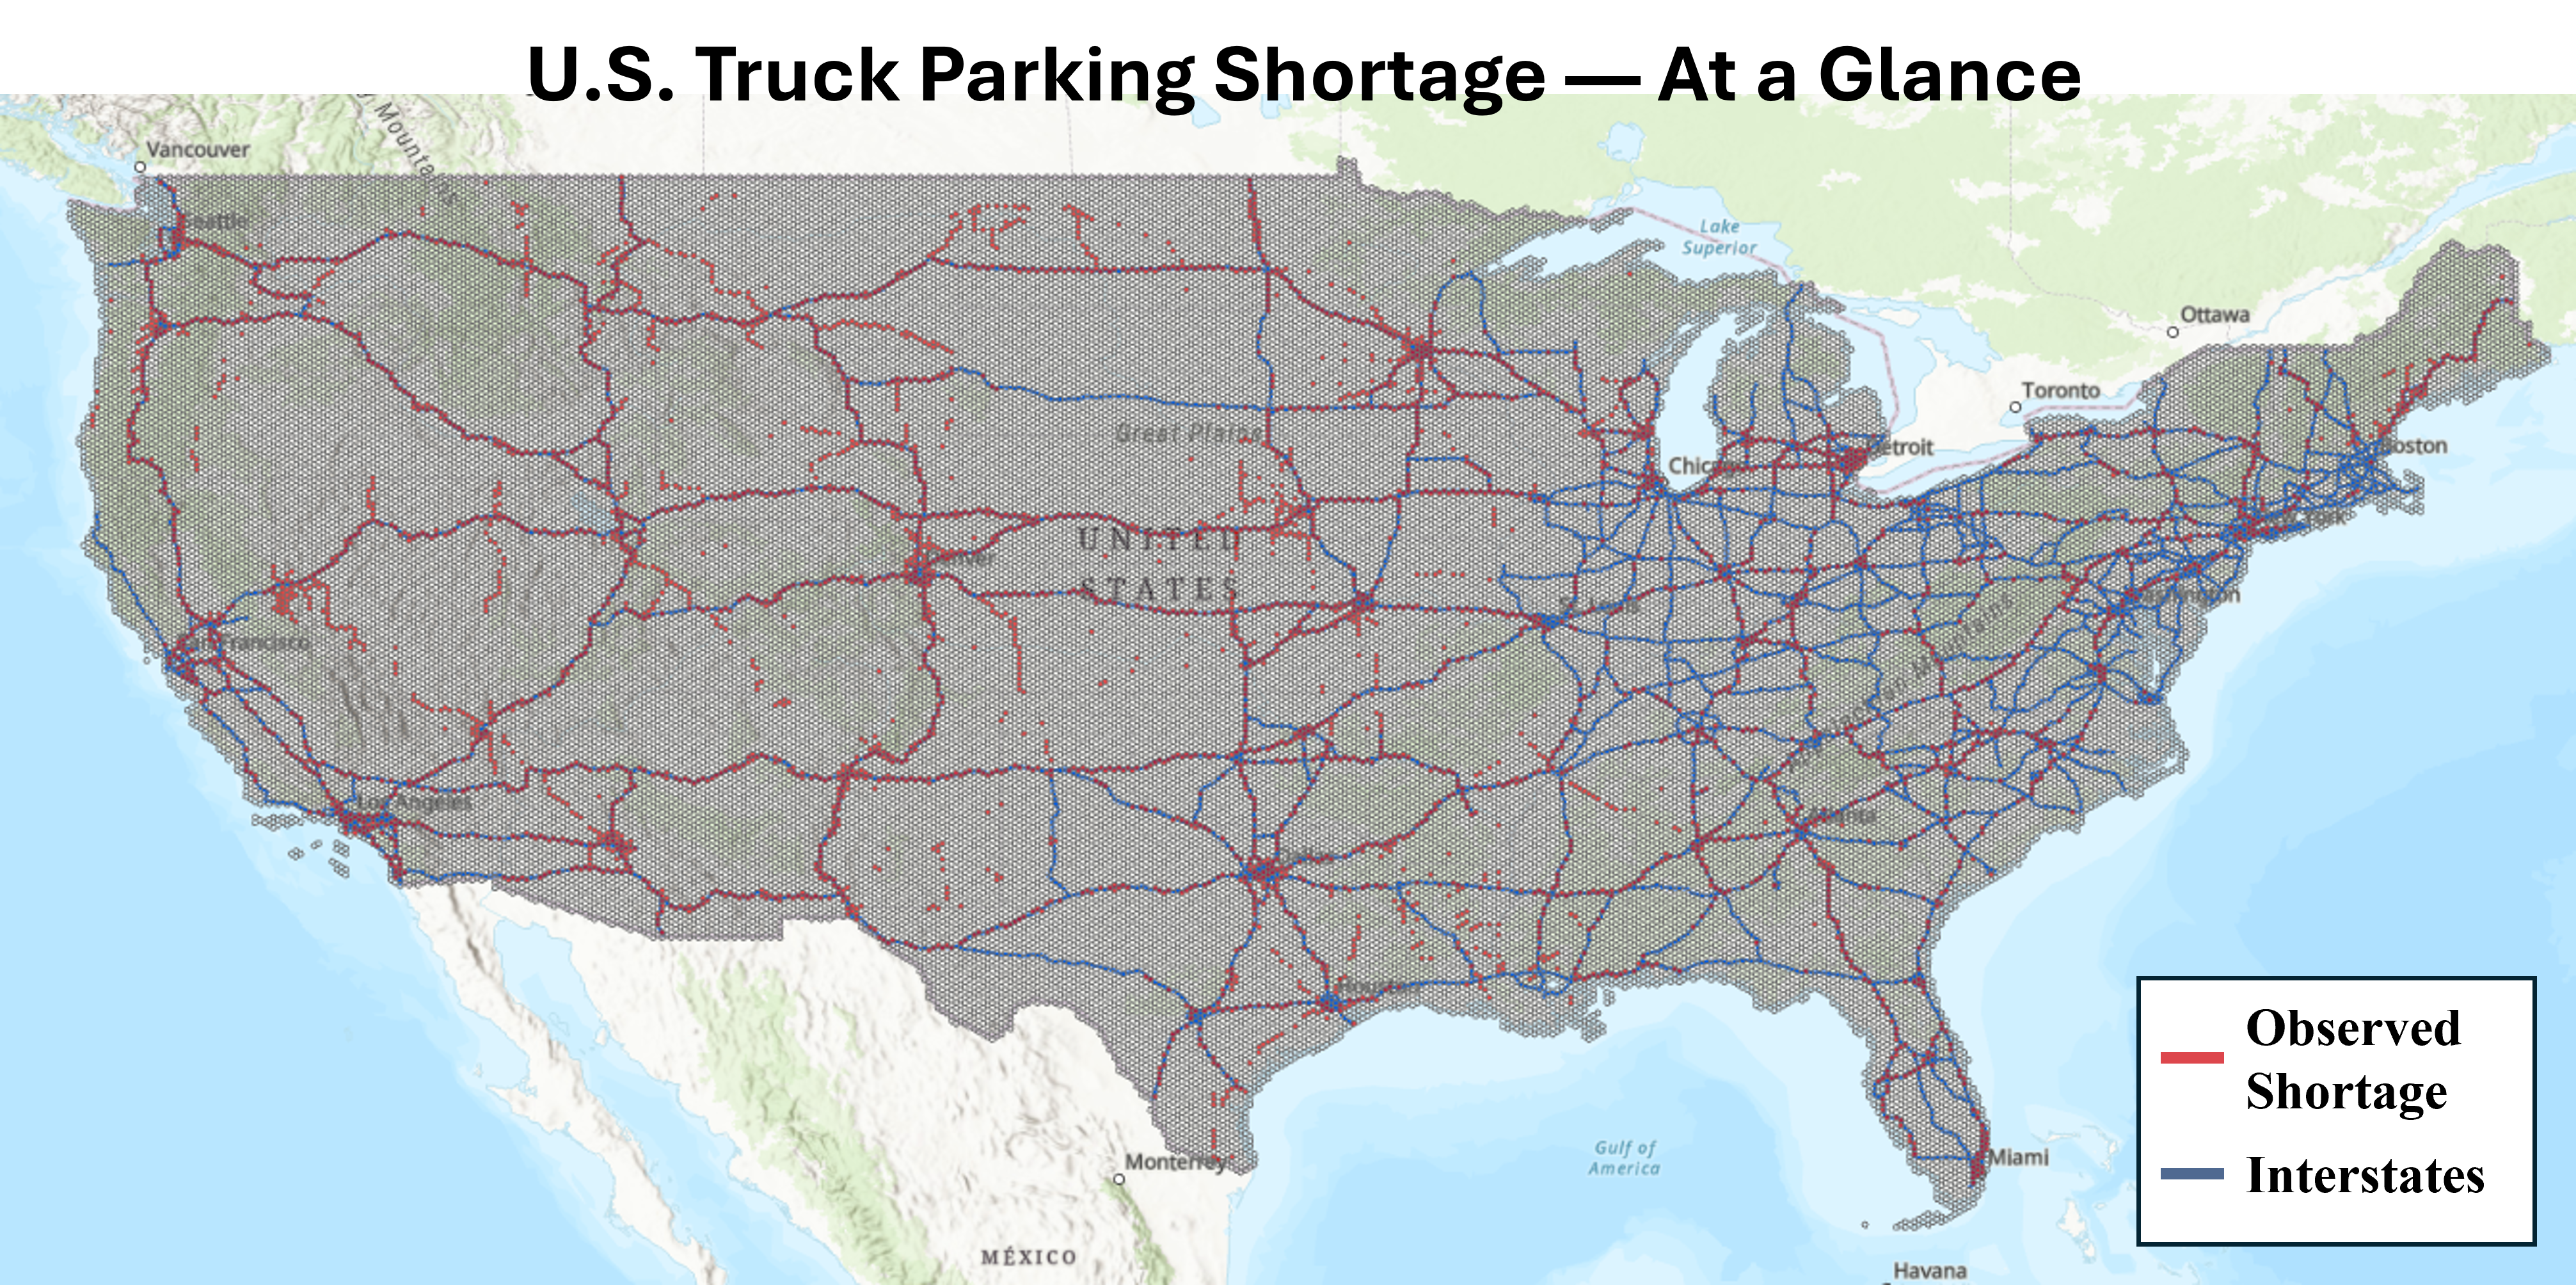
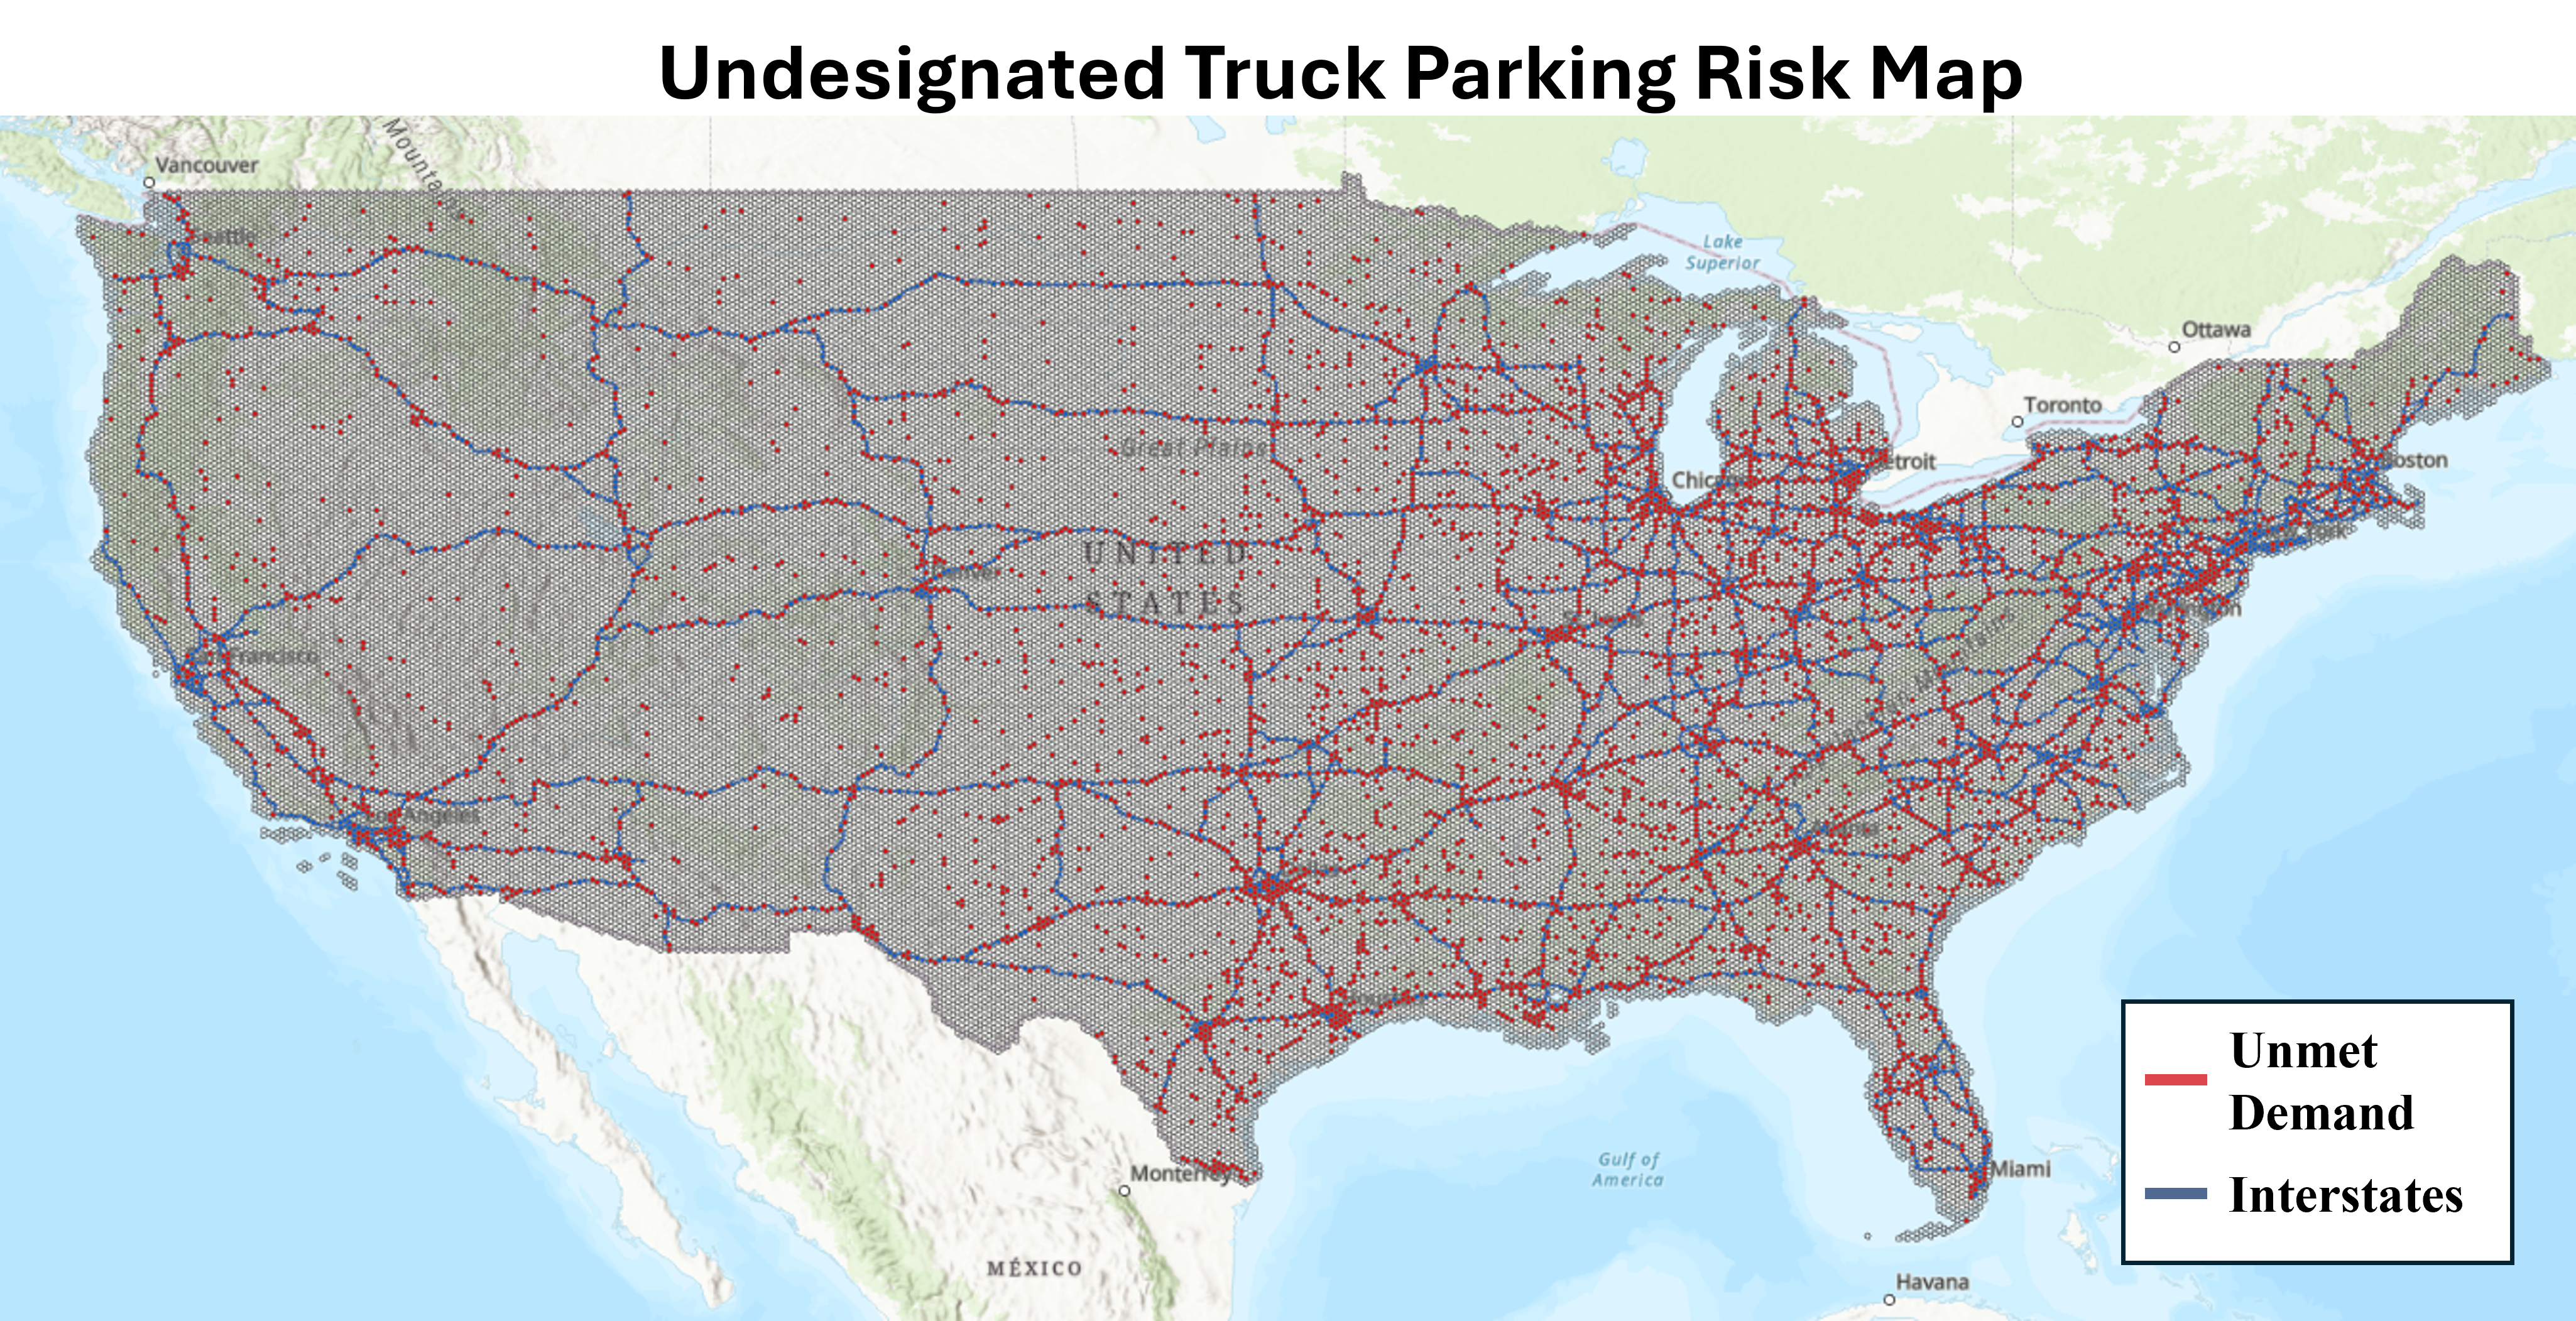
- Diagnose today’s hot spots and unmet need.
- Forecast tomorrow’s need by applying expected traffic growth.
- Gap analysis: Future need minus current capacity = where to add spaces.
What This Means for Policy and Planning
- Traffic is the reliable driver of demand: AADTC gives a strong, consistent baseline for forecasting.
- Aim dollars where gaps will open: Use the gap map to rank hexes, then group neighboring hot spots into corridor projects to speed delivery and cut unit costs.
- Use the right tool for the right place: In “normal” corridors, the traffic-only forecast works well. In complex hubs or policy-constrained areas, lean more on the diagnostic view (amenities, fees, operations) to shape solutions.
Practitioner Insights
- Program-ready workflow: The diagnose → forecast → gap flow fits grant scoring, STIP updates, and performance dashboards.
- Clear public–private split: Let the predictive result size total capacity; let the diagnostic view guide amenity mix and operating models with private partners.
- When prediction struggles: In highly constrained metros or policy-driven networks, pair the traffic baseline with on-the-ground diagnostics to avoid over- or under-building.
Conclusion
This approach shows how planners can forecast truck parking need without costly infrastructure. It offers a scalable, cost-efficient way to target investments where they’ll matter most, from national corridors down to state programs.
Download the 2025 Truck Parking Demand Model (Technical Summary)