
Truck Parking Inventory Methodology
Count Usable Capacity—not Just Marked Spaces
Accurate truck parking inventories must reflect how drivers actually use a facility. Marked-space counts alone can understate capacity, while published estimates may overlook obstacles, trailer drops, new construction, and unmarked parking areas.
A quick capacity test
Before reviewing the framework, estimate the capacity of this Kentucky public rest area.
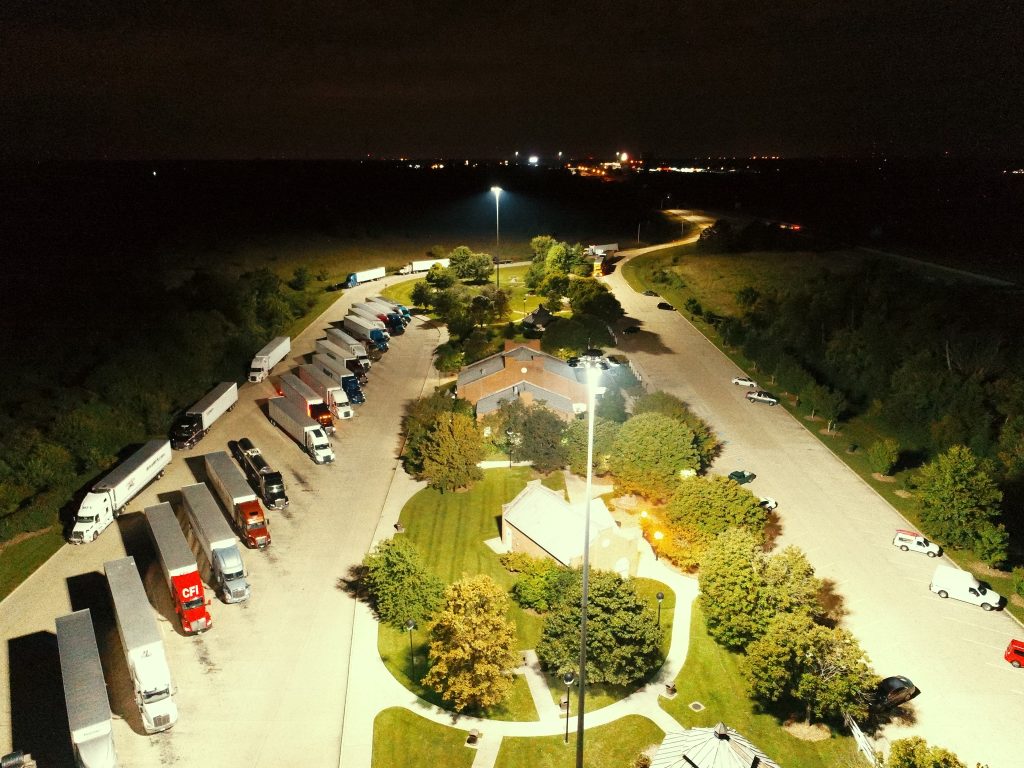
A marked-space count may suggest approximately 20 trucks.
The practical capacity is closer to 30 trucks.
Drivers use corners, curbs, and open pavement that are not included in the official marked-space count. This “creative parking” shows why real-world capacity can differ from inventory records.
A flexible framework for different parking environments
No single counting method works for every facility. Use the method that best matches the site, then verify the result with a second source.
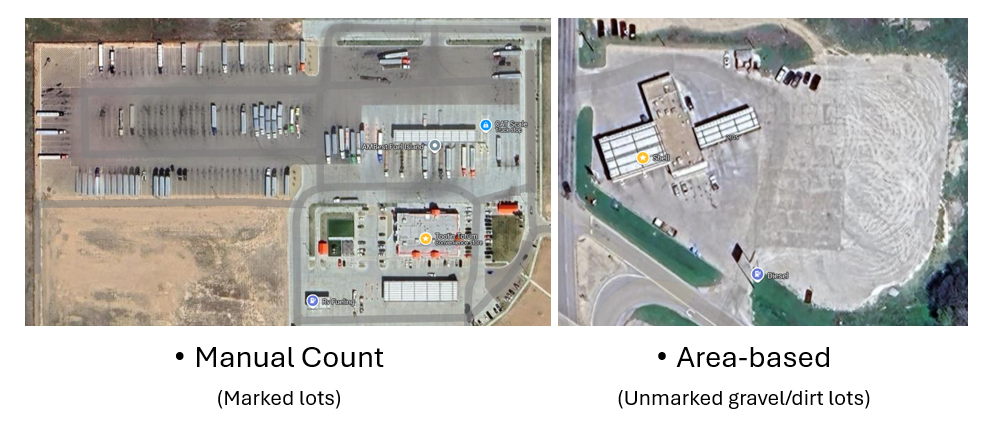
Public facilities: Count marked and managed spaces
Rest areas, weigh stations, and service plazas often have clear pavement markings and published capacity records.
Google Earth Satellite imagery Street View State DOT records
- Manually count current marked spaces using imagery.
- Compare the count with state freight plans, DOT inventories, and truck parking studies.
- Record additional areas that drivers use when the marked section fills.
Private truck stops: Verify published capacity
Large chains such as Pilot, Love’s, and TA may publish capacity figures, but those numbers still require verification.
- Terminology gaps: Published counts may combine bobtail spaces with spaces for 65+ foot tractor-trailers.
- Outdated imagery: Satellite and street imagery may not show recent construction or expansions.
- Best practice: Cross-check company records with current imagery and direct facility outreach.
Unmarked facilities: Estimate capacity by area
Restaurants, malls, casinos, gravel lots, and informal parking areas may have no marked truck spaces. Estimate their usable area instead.
- Measure the practical parking area.
- Apply a space-per-truck assumption.
- Reduce the estimate for access, obstacles, and behavior.
Driver data: Verify what happens in practice
Imagery and published records show physical space. Driver reports show whether that space is usable, safe, accessible, and available at night.
- Review recent driver comments and location reports.
- Check for temporary closures or access restrictions.
- Identify repeated reports of unsafe or unusable sections.
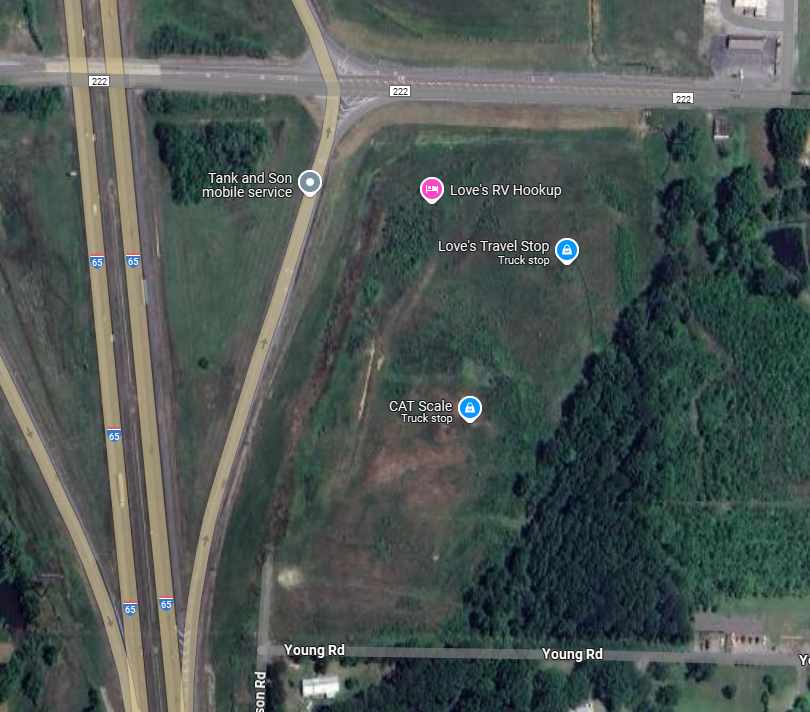
Example: New facilities may not appear in current imagery
Why one source is not enough
Truck stop operators may expand a site or open a new facility before satellite and street imagery are updated.
A reliable inventory should compare operator information, imagery, public records, and direct confirmation instead of treating any single source as definitive.
Area-based estimation for unmarked lots
When painted spaces are unavailable, estimate capacity in three steps.
Measure the usable area
Use Google Earth’s measurement tool or GIS software to outline the portion of the property that trucks can realistically access and use.
Example: 10,764 square feet.
Estimate area required per truck
A standard semi-truck may require approximately 400–500 square feet before site-specific reductions.
- Truck dimensions: Approximately 8.5 feet wide and 65–70 feet long, plus maneuvering or buffer space.
- Lateral arrangements: Drivers may leave approximately 13–14 feet between trucks.
- Linear arrangements: Single-file parking may require approximately 80–90 feet per truck.
A reasonable initial range would be approximately 20–30 trucks.
Apply reduction factors
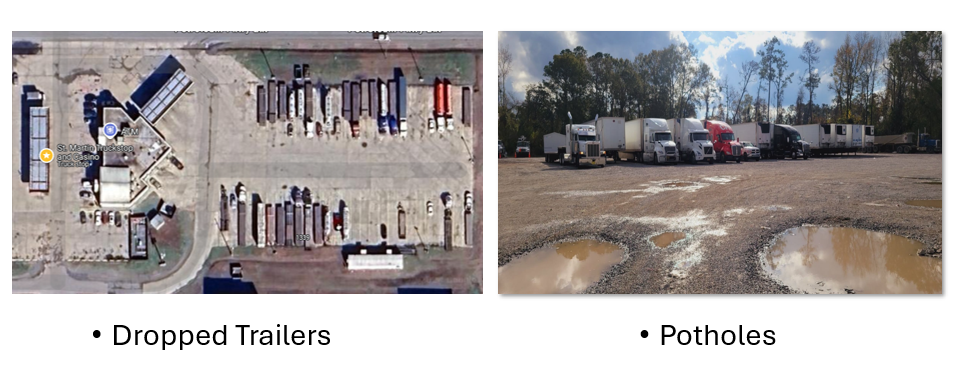
Reduce the theoretical count for conditions that limit actual use.
- Potholes or uneven terrain
- Trailer drops
- Blocked access or turning areas
- Poor lighting or perceived safety concerns
- Seasonal mud, snow, or drainage problems
Physical capacity is not always usable capacity
Recommended reduction checks
- Compare theoretical capacity with visible nighttime parking patterns.
- Review Google Maps comments for recurring complaints about access, pavement, lighting, or safety.
- Contact facility owners when published capacity and observed use differ.
- Record whether dropped trailers occupy spaces intended for active trucks.
- Apply additional reductions to gravel or dirt areas during poor weather.
The strongest inventory combines physical and driver-reported data
Satellite imagery and area calculations estimate how many trucks could fit. Driver reports help determine how many trucks can actually park safely and reliably during the hours that matter most.
Physical evidence
Marked spaces, usable pavement, facility layout, access points, and observable overflow areas.
Operational evidence
Driver updates, facility-owner confirmation, temporary restrictions, safety conditions, and nighttime parking behavior.
Platforms such as My Rig Parking and driver forums can help identify recent conditions that static inventories may miss.
A practical path toward more consistent inventories
No universal formula can capture every parking environment. States and planners can still improve consistency by separating marked capacity from practical capacity, documenting assumptions, applying site-specific reductions, and verifying estimates through multiple sources.
The recommended framework combines published records, current imagery, area-based calculations, direct facility confirmation, and driver-reported conditions. Dynamic tools, including crowdsourced updates or sensor-supported systems, can strengthen the inventory further.
Latest Articles/Posts
Authored, reviewed, and approved by Troy Choi, Ph.D., P.E. – Transportation Systems Optimization & Engineering Research. Google Scholar (as of 2025): Citations 168 | h-index 4 | i10-index 4