
Demand modeling
From FAF to facility: a hybrid parking demand model
National freight data shows how much is moving. It does not show where trucks stop. Planners need both a corridor view and a facility view to decide where parking belongs.
The problem
A growing shortage, and no clear map of where to build
Rising freight volumes, ELD mandates, and local opposition keep widening the gap. Federal efforts such as the Truck Parking Safety Improvement Act add funding, but planners still struggle to say where parking is needed and how much.
The answer is a bottom-up, facility-driven view of demand.
Macro models
Why the Freight Analysis Framework is not enough
The FAF is built from aggregated freight flows. Two limits follow.
- Indirect correlationFAF counts trucks on links. It does not track where they stop, whether at a rest area or an industrial site.
- Spatial blindnessAggregated data cannot resolve county, corridor, or facility needs. Funding can land on a highway segment that meets local resistance while demand clusters near logistics hubs.
Existing models
Two models, two scales
01 · Segment level
FHWA 2002 segment-based model
Estimates demand along highway segments from traffic, driver behavior, and facility preference.
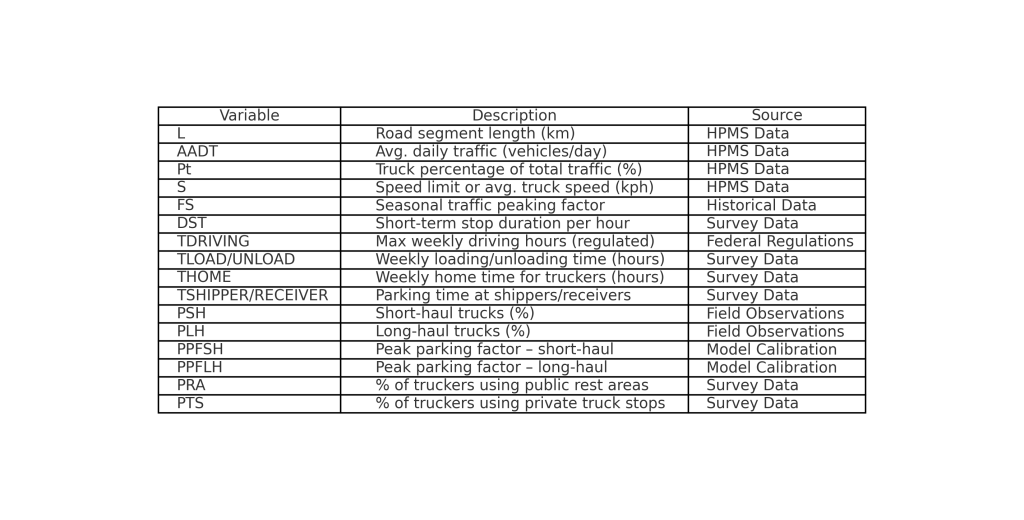
- InputsTraffic data (AADT, truck share, speed limits), driver surveys (rest periods, loading times), and the split between public rest areas and private truck stops.
- StrengthsCalibrated with field surveys in eight states. Summed across the 29 surveyed segments, modeled demand came within 2% of observed. That is a calibration result for the total, not long-term forecast accuracy.
- LimitationsOutdated. Misses local factors such as warehouse density. Individual segment errors reach ±30%.
02 · Facility level
Guerrero et al. (2023), facility-centric model
Links parking demand to industry type and facility size.
- InputsATRI truck GPS data, NAICS industry codes, and peak occupancy to flag likely illegal parking hotspots.
- FindingsDemand is 2 to 4 times higher near logistics warehouses and mining sites. Parking peaks between 7 and 10 p.m. Larger facilities draw more demand. Wholesale businesses average 1.5 nighttime spaces per site.
- ApplicationsIndustry-specific parking requirements (for example, 20+ spaces for logistics warehouses) and GPS-based hotspot detection, such as shoulder parking near mines.
- LimitationsUses current data only, so it cannot forecast long-term trends. Based in Phoenix, so it may need validation elsewhere.
Hybrid framework
Use each model for what it does well
No single model is enough. The macro view sets the corridor. The facility view sets the site.
| Model | Use case | Data needs |
|---|---|---|
| FHWA segment model | Long-term highway corridor planning | HPMS traffic data, driver surveys |
| Guerrero facility model | Zoning, industrial park design | GPS data, NAICS employment records |
Step 01
Map existing demand
Use GPS and land-use data to see where trucks actually stop.
Step 02
Calibrate locally
Check the model against driver surveys in your state.
Step 03
Project forward
Overlay economic growth projections on the facility-level demand map.
Conclusion
Precision requires granularity
- Get better dataPush for truck GPS sharing or expand state driver surveys.
- Combine both viewsFAF for funding advocacy. Facility models for siting.
- Answer local concernsUse granular data to show how new parking reduces roadside idling.
Without facility-driven models, agencies risk building the wrong parking in the wrong places.
Sources
- FHWA, Study of Adequacy of Commercial Truck Parking Facilities (2002).
- Guerrero et al., facility-centric truck parking demand study, Transportation Research Record.
- Bureau of Transportation Statistics, Freight Analysis Framework.
- U.S. Congress, Truck Parking Safety Improvement Act.
Related research
Authored, reviewed, and approved by Troy Choi, Ph.D., P.E. Transportation Systems Optimization and Engineering Research.
Start with facility-level data for your state
Verified inventory, 24/7 utilization patterns, and corridor demand screening, ready on Day 1.