
If One Rest Area in Your State Closes, Where Do the Trucks Go?
A facility-level criticality analysis for closure, rehabilitation, capacity preservation, expansion, and new construction decisions
State DOTs and consultants routinely evaluate rest-area closures, reconstruction, and new truck parking investments. Traditional inventories show how many spaces exist, but not what happens when one facility is removed. Facility criticality fills that decision gap by showing how much burden a closure places on the surrounding legal parking network.
Three National Findings
About one in four public-facility removals leaves some demand unabsorbed within 30 miles.
Most unabsorbed demand occurs even when a qualifying alternative is nearby. The main issue is residual capacity, not facility count.
Within five miles, nearly all removals leave some demand unabsorbed, showing how little short-distance network slack exists.
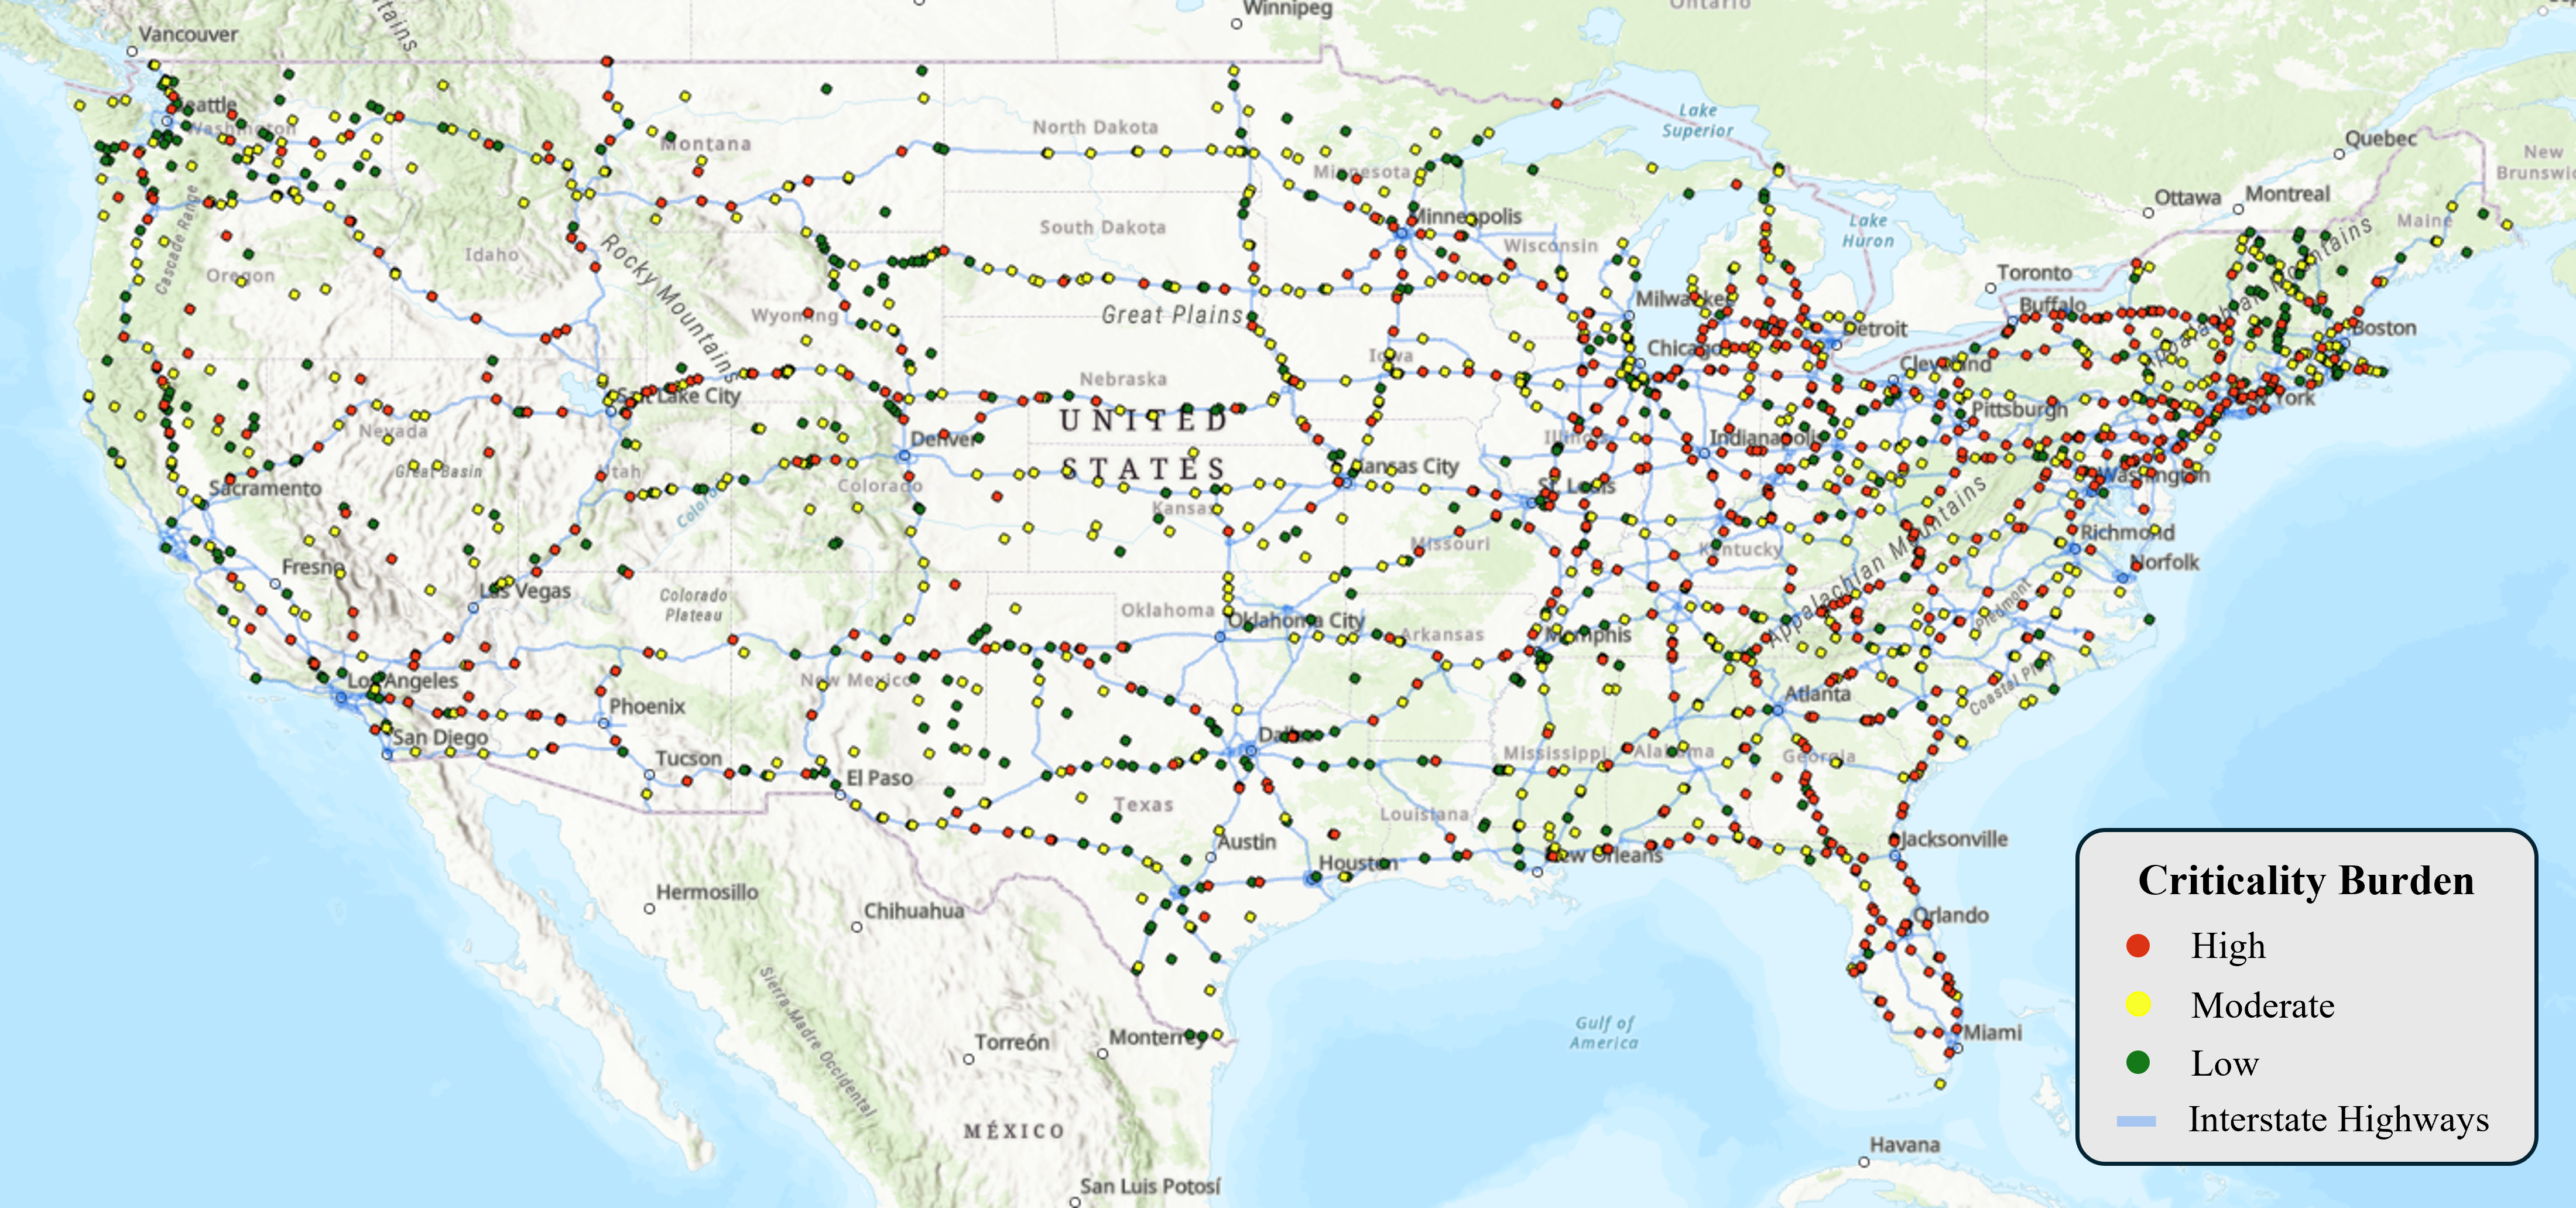
From a National Study to Your State
The national ranking is the starting point. The practical product is a state-, region-, or corridor-specific facility criticality analysis built around local projects and decisions.
This analysis depends on My Rig Parking’s facility-level inventory and utilization estimates. Those data make it possible to evaluate not only where alternatives exist, but whether they have enough residual capacity to absorb displaced trucks.
How Agencies and Consultants Can Use Facility Criticality
- State DOTs: prioritize maintenance and rehabilitation, protect high-criticality facilities, and plan temporary closures before capacity is taken offline.
- MPOs and consultants: add facility-level evidence to freight plans, truck parking studies, corridor assessments, and grant applications.
- Expansion planning: identify where added spaces would improve network redundancy and reduce unabsorbed demand.
- New construction: screen corridors where a new facility would provide the greatest network benefit.
- Policy review: identify where closure may shift displaced trucks toward paid parking and transfer costs to drivers.
- Project phasing: compare mitigation options such as temporary capacity, staged construction, or maintaining partial operations.
What High Facility Criticality Looks Like
Vince Lombardi Service Area, New Jersey
Numerous alternatives surround the facility, yet most displaced demand still cannot be absorbed within the local network. The lesson is simple: more nearby facilities do not necessarily mean more available capacity.
Greenfield Rest Area, Indiana
The analysis identifies this facility as having high criticality. During an actual closure, nearby ramp parking increased, providing a real-world example of how displaced demand can move to undesignated locations when legal capacity is insufficient.
Frequently Asked Questions
What does facility criticality mean?
Facility criticality measures the burden that the loss of one public truck parking facility places on the surrounding legal parking network. It reflects displaced demand, available residual capacity, and redistribution distance.
How is this different from a standard truck parking inventory?
A standard inventory shows supply, location, and utilization. Facility criticality shows the consequence of losing a specific facility and whether the surrounding network can absorb that loss.
Can the analysis be customized for my state or corridor?
Yes. A customized analysis can use local facility data, planned projects, agency-defined search distances, and state or corridor priorities to produce facility-level rankings and maps.
What can a sample state-level output include?
A sample output may include a statewide criticality map, facility ranking, closure or rehabilitation screening, corridor summaries, and locations where expansion or new construction could strengthen the network.
Can facility criticality support both existing and new facilities?
Yes. It can help protect or rehabilitate existing facilities, plan temporary closures, identify expansion needs, and screen where new truck parking would provide the greatest network benefit.
What data make this analysis possible?
The analysis uses facility locations, parking capacity, overnight-parking eligibility, public or private status, road-network distance, and facility-level utilization estimates. My Rig Parking maintains the inventory and utilization foundation needed for customized analysis.
Learn More
Contact us for a brief walkthrough of how facility criticality works, a sample state- or corridor-level output, or a discussion of how the analysis could support an upcoming truck parking study, closure review, rehabilitation program, expansion, or new facility plan.